Recessions are a natural part of the business cycle started by imbalances in the economy during market corrections. As well, periods of declining GDP often signal an impending recession. Both scenarios can make investors nervous.
Since 1945 there have been a total of 13 recessions, on average six years apart. Not all of them have been immediately apparent. In fact, the National Bureau of Economic Research, which officially determines the beginnings and ends of recessionary periods, usually takes about six to nine months to determine its findings.
With equity prices traditionally based on economic expectations for the future six to 12 months, reactionary pressures can be seen in markets before a recession is officially declared. On the other hand, during recessions the markets can often reflect positive expectations for the near-future economy.
A common fear among investors is that negative returns are generated during bear markets brought on by a recession. But studies demonstrate otherwise. The S&P 500 typically peaks about seven months before a recession officially begins, then bottoms out four months before the recession ends.1 As such, markets produce a positive return more often than not from the beginning to the end of a recession.
The following graph represents the historical returns during recessionary periods from February 1945 to April 2020. It shows that seven of the 13 recessions produced positive returns of more than 4 percent.
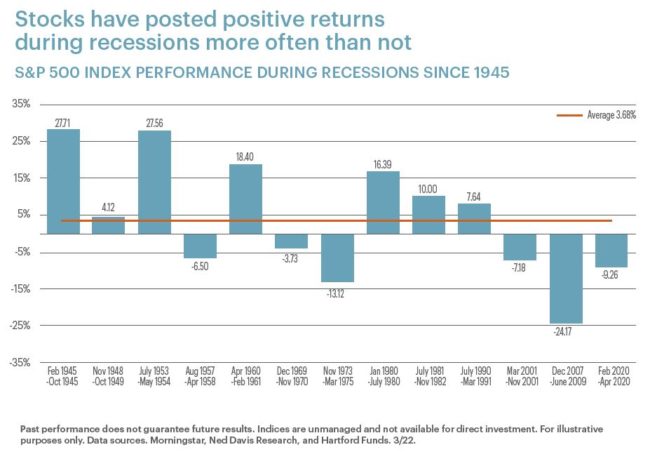
The recession of 1945 generated the highest return of 27.71 percent. Altogether, the average return over the 13 recessions is a positive 3.68 percent, proving that the stock market does not always move in the same direction as the economy.
Post-recession expansion
Other studies show that an expansion after a recession is much stronger and more impactful than the recession itself.
According to research from the Federal Reserve Bank of Cleveland, there is a strong correlation between the severity of a recession and the strength of the expansion that follows. In fact, the worse the recession, the stronger the comeback. During the 18 months of the Great Recession that started in 2007, GDP fell 4.3 percent overall. It was the longest recession in U.S. history followed by the longest expansion on record of more than 10 years. The same research did not find that a lengthy expansion led to a more difficult, enduring recession.
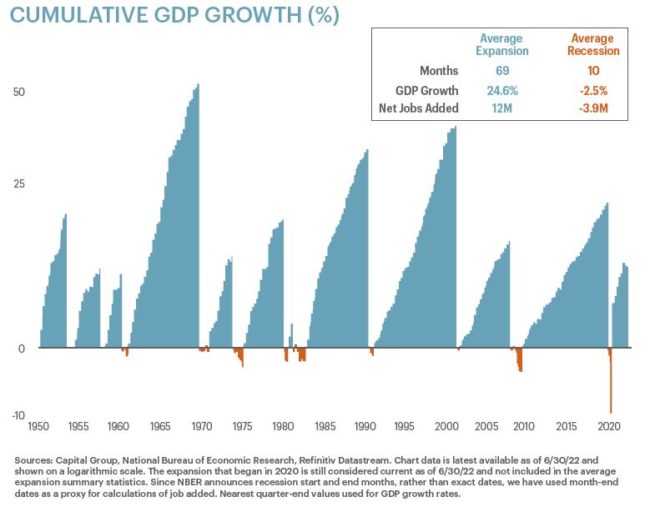
The following graph shows how much more powerful the expansionary periods that follow recessions are than the recessions themselves. The blue areas above the baseline represent the length of each expansion (horizontal) and the growth in cumulative GDP (vertical) during the respective timeframe. The purple bars below the line represent the recessions that preceded the expansions. The average recession has lasted around 10 months, the average subsequent expansion around 69 months, with much greater GDP growth than the GDP lost from the previous recession.
Investors are cautioned not to try to time the markets. Holding investments through a market downturn is a better strategy as markets have always rebounded and moved higher. It can be difficult to remain patient as markets decline, but doing so continues to prove wise.
1Source: Forbes: “How Does The Market Perform During An Economic Recession? You May Be Surprised,” by Sergei Klebnikov
IMPORTANT DISCLOSURES
The information included in this document is for general, informational purposes only. It does not contain any investment advice and does not address any individual facts and circumstances. As such, it cannot be relied on as providing any investment advice. If you would like investment advice regarding your specific facts and circumstances, please contact a qualified financial advisor.
Any investment involves some degree of risk, and different types of investments involve varying degrees of risk, including loss of principal. It should not be assumed that future performance of any specific investment, strategy or allocation (including those recommended by HBKS® Wealth Advisors) will be profitable or equal the corresponding indicated or intended results or performance level(s). Past performance of any security, indices, strategy or allocation may not be indicative of future results.
The historical and current information as to rules, laws, guidelines or benefits contained in this document is a summary of information obtained from or prepared by other sources. It has not been independently verified, but was obtained from sources believed to be reliable. HBKS® Wealth Advisors does not guarantee the accuracy of this information and does not assume liability for any errors in information obtained from or prepared by these other sources.
HBKS® Wealth Advisors is not a legal or accounting firm, and does not render legal, accounting or tax advice. You should contact an attorney or CPA if you wish to receive legal, accounting or tax advice.