Updated Study on Diving Deeper into the Active vs. Passive Debate
When investing, investors can choose either passively managed funds or actively managed funds. Passively managed funds invest in a portfolio that simply mirrors a market index. In contrast, actively managed funds have portfolio managers who attempt to outperform a market index by utilizing a particular investment strategy.
Many studies have shown that the average return of all actively managed funds within certain fund categories has failed to match the returns of passively managed funds. Passively managed mutual funds and exchange-traded funds (ETFs) also typically have lower expense ratios than actively managed funds, so it is not surprising that some investors have concluded that they would be better off investing exclusively in passively managed funds in all asset classes.
However, we believe there are at least two flaws in this line of reasoning. First, in most of the studies the only asset class tested was large cap domestic equities. This ignores managers in other asset classes that may have more success beating their benchmarks. Second, these studies only indicate that it is better to use a passively managed fund instead of the “average” actively managed fund. However, this “average” fund performance includes many small funds with inexperienced managers that no investment professional would likely consider utilizing for their clients.
The HBKS® Asset Management team decided to dig deeper to account for both shortcomings. Several years ago, we did an independent study to see for ourselves if active management adds value. We began with the Morningstar database of more than 7,000 mutual funds. We then removed all funds with less than $100 million in assets under management and removed all funds whose primary portfolio manager has been managing the fund less than five years. We then separated the funds by the asset class categories listed in the chart below.
We believe performance comparisons should only be made over a market cycle, so for each fund we calculated the three-year annualized returns for each calendar year-end going back 20 years (from 1996 through 2016). For each of the 20 periods, we calculated the average fund performance within each category for those funds that had performance during that entire period.
Since it is impossible to invest directly in an index, we compared our results to a passive Exchange Traded Fund (ETF) that seeks to replicate the primary benchmark within each asset class. We then substituted the index performance within any category that the ETF did not have enough history to fill out the 20 periods.
Recently we updated the study through 2020 because the past several years have been rough on active managers. The results now, as they did then, paint quite a different picture than the studies that simply use the average returns for all active domestic large cap funds. Outside of the large- and mid-cap domestic equity asset classes, the elimination of smaller actively managed funds and those with short management tenures substantially improved the probability of selecting a fund that outperforms its benchmark over the long run.
The analysis indicates that there is a high probability that utilizing active management will add value in many asset classes. One possible reason for this is that in some markets, information is much harder to obtain, so it is far more likely that an active manager can gain an information advantage versus other investors in these markets. The addition of the most recent four years caused the percentage of time the average active manager beat their benchmarks over a three-year period to drop, but the conclusions from the study did not change.
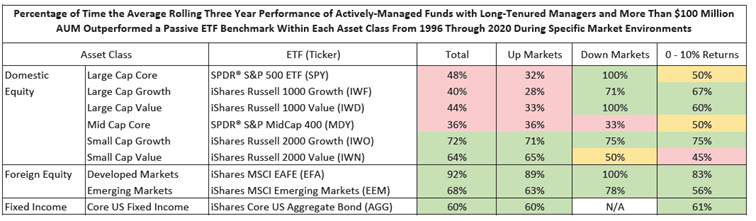
The results also show that the market environment is an important factor to consider when deciding between active or passively managed funds. During periods where the market posts negative returns, the probability that an actively managed mutual fund with long-tenured managers and at least $100 million under management will outperform a passive strategy is 50 percent or better in every asset class except for one (US Mid Caps). It appears that, even in the large- and mid-cap domestic equity asset classes, active management can help lessen the short-term drop in assets when the market turns sour.
This is particularly important in the current market environment. Stocks have been on an almost uninterrupted march higher since the pandemic-induced sell-off last year, and stocks are reaching valuation levels that appear high by historical standards. Many experts expect modest returns over the next several years in most asset classes, possibly between 0 and 10 percent. The column on the far right of the table illustrates what the historical probability of out-performance by funds with long-tenured managers and at least $100 million under management. In this market environment, the average of these funds has outperformed the passive ETF quite often in most asset classes. This may mean the market environment over the next several years will favor active management.
Of course, our process in selecting which actively managed fund we include in our clients’ portfolios is much more involved than what is described in this article. Within each asset class, we look further into the manager’s process, philosophy, and discipline. This helps us identify those managers within this group who have a disciplined process that is repeatable and are most likely to continue posting superior performance.
At HBKS® Wealth Advisors we recognize the importance of utilizing both active and passive management. For example, active management is much more likely to pay off in the domestic small cap, foreign equity, and fixed income asset classes. Domestic Large-Cap Core and Domestic Mid-Caps, on the other hand, are very efficient markets where it is very hard to gain an informational edge. As a result, we use passive management in those asset classes. We believe this approach, versus a purely passive portfolio, can add value while keeping overall costs much lower than a purely active methodology.
IMPORTANT DISCLOSURES
DEFINITIONS
Domestic Equity – Although the economic environment continues to be favorable (inflation remains under control, interest rates are still low, and jobs are being created), there are several reasons to be cautious. First, strong economic growth and rising input costs are sparking speculation that the US Federal Reserve will hike rates more aggressively to head off inflation. Second, the trade war with China remains a concern, although negotiations with the EU, Mexico and Canada are promising. Finally, the strong performance of just a handful of growth stocks has been driving domestic stock performance. As a result, valuations in growth stocks have become much more elevated than value stocks. Also, rising interest rates should hurt growth stock prices more than value. As a result we favor value stocks over growth stocks.
Foreign Equity – Tax cuts are being discussed in many major developed countries (Belgium, France, Sweden, Norway, Denmark and Germany), which may help to boost global economic growth. Asian Large Caps are also benefiting from the region’s tax race to the bottom. Foreign developed stocks still have less expensive valuations than their peers in the United States. So while they may continue to be volatile, foreign developed stocks could assume leadership going forward. The Emerging Markets are growing faster and are cheaper than the developed markets, but instability in Turkey and Italy, as well as rising interest rates and a stronger dollar in the US, may cause emerging stock markets to continue to struggle.
Fixed Income – The spread between Baa and Aaa-rated corporate bonds continues to widen, this preference for higher quality may be due to the confluence of Fed rate increases, EU disintegration fears, and trade tensions. Continued Fed rate increases could create further headwinds for the global economy. Floating Rate and Unconstrained Bond Funds provide some flexibility in managing around the uncertainty of the Fed’s movements.
S&P 500 Index – A market-capitalization-weighted index of the 500 largest U.S. publicly traded companies by market value. The S&P 500 is one of the most common benchmarks for the broader U.S. equity markets.
Russell 1000 Index – The Russell 1000 Index is an index of approximately 1,000 of the largest companies in the U.S. equity index.
Russell 2000® TR Index – The Russell 2000® Index measures the performance of the small-cap segment of the U.S. equity universe. The Russell 2000® Index is a subset of the Russell 3000® Index representing approximately 8% of the total market capitalization of that index. It includes approximately 2,000 of the smallest securities based on a combination of their market cap and current index membership.
Russell 1000 Growth Index – The Russell 1000® Growth Index measures the performance of those Russell 1000 companies with higher price/book ratios and higher forecasted growth values.
Russell 1000 Value Index – The Russell 1000® Value Index measures the performance of those Russell 1000 companies with lower price/book ratios and lower forecasted growth values.
MSCI Developed EAFE (USD) TR Net Index – The MSCI EAFE (Europe, Australia, Far East) is a stock index designed to measure the investment returns of the developed countries outside of North America. The index includes stocks from 21countries with the most recent addition being Portugal in 1997. The process used to select stocks for the EAFE index is quite extensive. The stocks from each country are divided into industry groups and then representative stocks are selected from each industry group. This ensures that all industries are proportionally weighted in the index. The MSCI EAFE also ensures that stocks in the index have good liquidity and free float (percentage of shares freely tradable). In addition, cross-ownership (one company owning significant portion of another company) is tracked to ensure that the market weight given each company is accurate.
MSCI Emerging Markets (USD) TR Net Index – The Morgan Stanley Emerging Markets Index is a broad-based, capitalization-weighted index comprised of approximately 30 emerging market countries. This index is constructed to ensure the proper representation of the countries’ underlying industry distribution and market capitalization, and allows investors to accurately compare equity performance across these emerging markets countries. The largest countries represented in this index include Taiwan, Brazil, Mexico, South Africa, Malaysia, Korea and India.
Barclays U.S. Bellwether 3 Month Bond TR Index – The index measures the performance of Treasury bills with a maturity of less than three months.
The information included in this document is for general, informational purposes only. It does not contain any investment advice and does not address any individual facts and circumstances. As such, it cannot be relied on as providing any investment advice. If you would like investment advice regarding your specific facts and circumstances, please contact a qualified financial advisor.
Any investment involves some degree of risk, and different types of investments involve varying degrees of risk, including loss of principal. It should not be assumed that future performance of any specific investment, strategy or allocation (including those recommended by HBKS® Wealth Advisors) will be profitable or equal the corresponding indicated or intended results or performance level(s). Past performance of any security, indices, strategy or allocation may not be indicative of future results.
The historical and current information as to rules, laws, guidelines or benefits contained in this document is a summary of information obtained from or prepared by other sources. It has not been independently verified, but was obtained from sources believed to be reliable. HBKS® Wealth Advisors does not guarantee the accuracy of this information and does not assume liability for any errors in information obtained from or prepared by these other sources.
HBKS® Wealth Advisors is not a legal or accounting firm, and does not render legal, accounting or tax advice. You should contact an attorney or CPA if you wish to receive legal, accounting or tax advice.