In about three months, we’ll be casting our votes in the 2020 national election. Between now and election day, there will be plenty of arguing about how the outcome of the presidential election will affect the stock market.
Worried investors tend to wait until after an election has been decided before putting more money into equities. Historically, net asset flows into money market funds have been three times higher in election years than non-election years. More than how one candidate’s victory or the other will affect market prices, it is the uncertainty that sidelines investors.
So how has the U.S. Stock Market Performed During Presidential Election Years?
Consider the S&P 500 Index. Since 1932, the stocks in the S&P 500 have gained an average of 10.2 percent over the 12 months beginning May 31 before the election until May 31 after the election. That performance compares favorably to — nearly twice as good as — the average of 5.8 percent during this same period of time in non-election years.
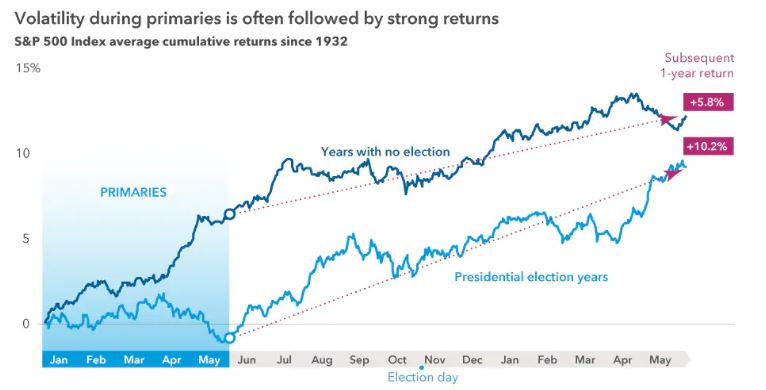
In the last 20 election years, stocks have posted negative returns only twice, in 2000 and 2008. Both of these declines were largely due to inflated asset price bubbles, not politics.
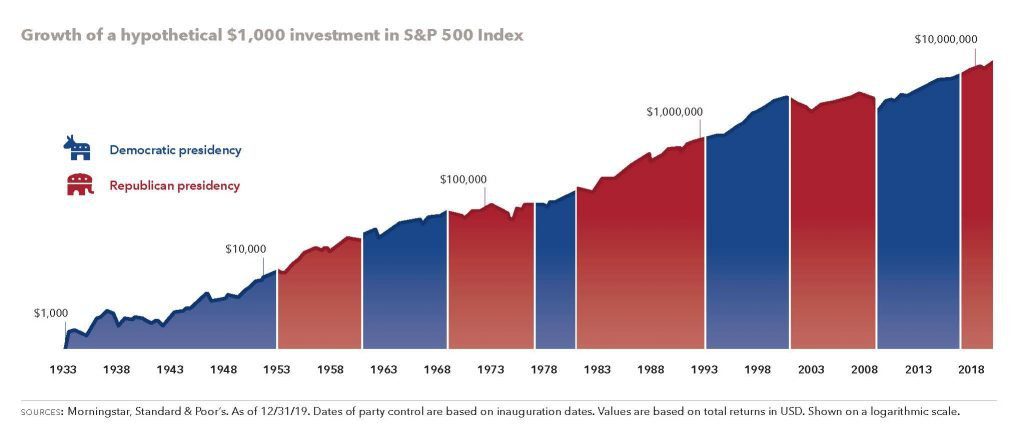
Is One Party Better than Another for Market Performance?
Since 1933, we have elected seven Democrat presidents and seven Republican presidents. A long-term investor who ignored which party was in office would have been rewarded. A thousand dollars invested in the S&P 500 Index in 1933 would have grown — steadily — to more than $14 million by the end of 2019. In a June 24 HBKS® webinar, Economist Brian Wesbury told HBKS® Chief Investment Officer Brian Sommers, CFA, “It’s not necessarily that presidential policies don’t matter, it is that economic growth will continue even if there are policy mistakes or anti-growth policies put in place.”
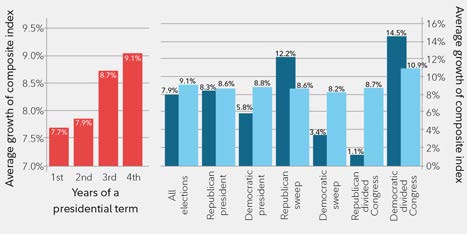
Jurrien Timmer, technical research analyst from Fidelity, researched the “Presidential Cycle’s” impact on stock market performance all the way back to 1789. Jurrien felt it was important to break up the president’s four-year term into two distinct periods of time due to the potential impact of mid-term elections on the incumbent president’s agenda. A comprehensive graph of his findings is listed below. While the market typically has performed better during the first two years of a Republican president, this difference typically reverts toward a mean return between the full four-year term of both parties with the four-year average for Republican presidents being +8.6 percent and +8.8 percent for Democrat presidents.
What the charts demonstrate is that it is never wise to try to time the market. It is time in the market vs. timing the market that works to keep investment portfolios growing. It is your long-term commitment and an appropriate asset allocation based on your risk tolerance that will keep you on track toward your financial goals.
Indeed there are many important issues facing our country in the upcoming presidential election, however the issues that will dictate the economy are related to earnings, interest rates set by an independent Federal Reserve, labor growth, productivity, and changes in consumer spending (for example, the trend toward more e-commerce/ online spending in the wake of the pandemic).
(Source: Capital Group “Guide to Investing in an Election Year”, Fidelity “Presidential elections and stock returns”
by Jurrien Timmer)
IMPORTANT DISCLOSURES
The information included in this document is for general, informational purposes only. It does not contain any investment advice and does not address any individual facts and circumstances. As such, it cannot be relied on as providing any investment advice. If you would like investment advice regarding your specific facts and circumstances, please contact a qualified financial advisor.
Any investment involves some degree of risk, and different types of investments involve varying degrees of risk, including loss of principal. It should not be assumed that future performance of any specific investment, strategy or allocation (including those recommended by HBKS® Wealth Advisors) will be profitable or equal the corresponding indicated or intended results or performance level(s). Past performance of any security, indices, strategy or allocation may not be indicative of future results.
The historical and current information as to rules, laws, guidelines or benefits contained in this document is a summary of information obtained from or prepared by other sources. It has not been independently verified, but was obtained from sources believed to be reliable. HBKS® Wealth Advisors does not guarantee the accuracy of this information and does not assume liability for any errors in information obtained from or prepared by these other sources.
HBKS® Wealth Advisors is not a legal or accounting firm, and does not render legal, accounting or tax advice. You should contact an attorney or CPA if you wish to receive legal, accounting or tax advice.