The year 2020 has been quite a bumpy ride, and after a very contentious election season, it doesn’t look like the ride will smooth out anytime soon. The ongoing pandemic, protests for social justice, wildfires, and now a presidential election have combined to send shock waves through the financial markets. Volatility has persisted with few periods of tranquility.
Even in a normal year, a presidential election, no matter who wins, adds volatility to a market. With this being one of the more controversial elections in recent history, we have seen increased headline risk. Election controversy, however, is not unprecedented. In 2000, the election came down to a single state. The “hanging chads” and a subsequent recount gave George W. Bush the state of Florida and the election by a margin of 537 votes. The process was long and arduous, creating significant volatility in the market. We did not know who actually won the election until the Supreme Court decided Bush v. Gore on December 12.
Between the large volume of mail-in ballots and early voting, the 2020 election may end up being just as contested and drawn out as 2000. So what happens to the markets during a contested election?
It’s not unusual for people to wring their hands over how the election of one candidate or the other might tank the market. However, every four years research proves that a party or candidate has little effect on the market in the long run. The Fed and economic conditions will always be the keys to the rise or fall of the market. There will be volatility around the election, but one party taking hold over another has not caused the tumble that many predict leading up to an election.
The fear leading to this election is a bit different. A drawn-out election process will inevitably inject doubt into the market, which in turn will cause more fluctuation than normally surrounds an election. In 2000, we did not see an immediate, precipitous drop as we’ve seen during this Covid-19-plagued year, but the S&P 500 was down 4.24 percent between election day on November 7 and the Supreme Court ruling on December 12. As the days crept on, greater uncertainty caused the market to drop and the VIX or “fear index” to rise.
But there is more to the story of the 2000 election. It took place shortly after the start of the burst in the tech bubble in that preceding spring. The S&P 500 was down 23 percent during the seven months surrounding the election, and it took more than two years for the market to bottom out and start to rebound. The following chart paints the bigger picture of the 2000 election:
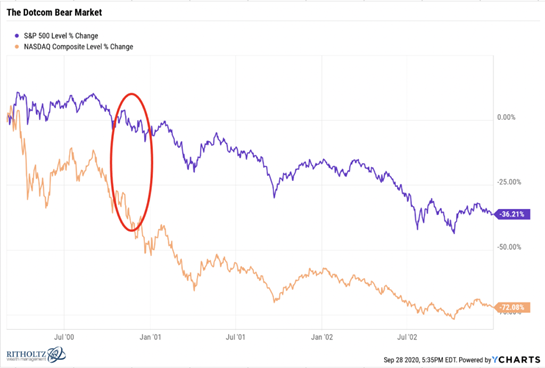
The red circle illustrates that time period between November 7 and December 12 when the election was contested. In the grand scheme of things, the dip due to disappointment in the election process and the uncertainty that came with it was small and gradual compared to the larger dips of the year. Moreover, the U.S. was in the midst of a year-long bear market that would see the S&P 500 drop 47 before finally recovering in 2002.
While volatility will accompany an election, and be a bit greater in a contested election, the more important takeaway is that the market will likely follow the path of the business cycle. Although the 2000 election is a sample size of one, volatility has marked many elections over the years. It does not foretell doom for years to come.
Current market conditions have us at the beginning of a recovery. The Fed has expressed its desire to remain extremely accommodative for many months to come, that it will be there to support the market in times of stress. This should at least alleviate some fears during an extended election, and help those considering trying to time the market to remain invested. Though headline risk will persist, the underlying market conditions are still strong enough to support incidental softness.
IMPORTANT DISCLOSURES
The information included in this document is for general, informational purposes only. It does not contain any investment advice and does not address any individual facts and circumstances. As such, it cannot be relied on as providing any investment advice. If you would like investment advice regarding your specific facts and circumstances, please contact a qualified financial advisor.
Any investment involves some degree of risk, and different types of investments involve varying degrees of risk, including loss of principal. It should not be assumed that future performance of any specific investment, strategy or allocation (including those recommended by HBKS® Wealth Advisors) will be profitable or equal the corresponding indicated or intended results or performance level(s). Past performance of any security, indices, strategy or allocation may not be indicative of future results.
The historical and current information as to rules, laws, guidelines or benefits contained in this document is a summary of information obtained from or prepared by other sources. It has not been independently verified, but was obtained from sources believed to be reliable. HBKS® Wealth Advisors does not guarantee the accuracy of this information and does not assume liability for any errors in information obtained from or prepared by these other sources.
HBKS® Wealth Advisors is not a legal or accounting firm, and does not render legal, accounting or tax advice. You should contact an attorney or CPA if you wish to receive legal, accounting or tax advice.