HBKS believes that a globally diversified portfolio that utilizes alternatives provides for the highest probability of success in meeting our clients’ investment goals.
Our philosophy is based on the premise that the best way to manage the risks inherent in investing is to maintain a broadly diversified portfolio across many asset classes, both foreign and domestic, including alternatives. Alternatives are investments which have a return profile with little correlation to either stocks or bonds and have the potential to lower the risk profile of our clients’ portfolios.
Recently, the performance of domestic large cap stocks has dominated every other asset class, prompting some to question the wisdom of this approach. This line of reasoning proposes that an investor would be better off utilizing a purely domestic-only portfolio composed of 60 percent S&P 500 Index and 40 percent Barclays Aggregate Bond Index (a Domestic- only Balanced Portfolio). Some even go as far as endorsing only investing in a domestic equity portfolio like the S&P 500 Index, which contains the largest 500 companies in the United States.
The HBKS Asset Management Group decided to test these theories by using Morningstar tools and research to back test the 20-year performance of all three of these investment approaches. Indexes were used to represent each asset class within the three allocations* and then each portfolio was constructed in the appropriate blend of indices. These blends were then back tested in the Morningstar Direct research software. While past performance does not accurately predict future performance, an analysis of the performance of these allocations over long periods of time and through multiple cycles can provide insight into how various asset classes may perform in different market environments.
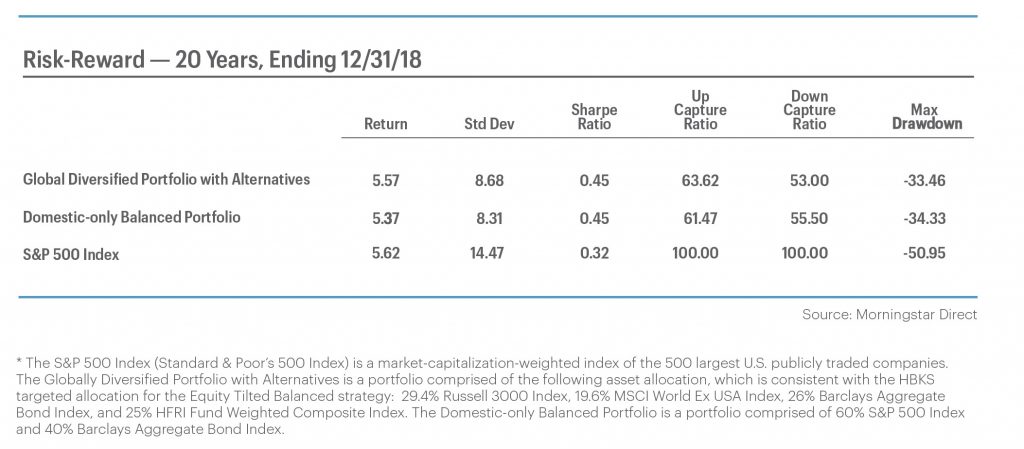
The results show that, over the past 20 years, a globally diversified portfolio that utilizes alternatives (GDPA) has outperformed the domestic-only balanced portfolio (DOBP) by 0.20 percent annually, with risk metrics that are similar. In addition, the performance of both the GDPA and the S&P 500 Index have been right around 5.6 percent, but the GDPA portfolio achieved this performance with much less risk.
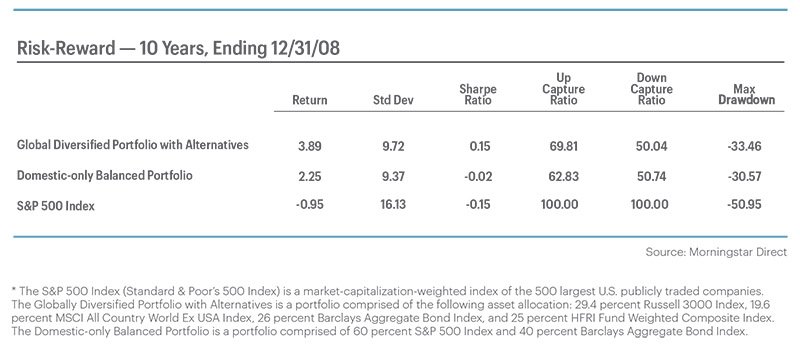
How these portfolios arrived at these performance results, however, was very different, even when comparing the two more diversified strategies, GDPA and DOBP. From 1999 until 2008, the first ten years of the period being studied, a GDPA approach would have outperformed a DOBP approach by 1.64 percent annually.
In the course of these initial ten years of the study the S&P 500 Index was down almost 1 percent annually, while the GDPA approach was up almost 4 percent annually. This is significant because the timing of an investor’s potential need for cash is very unpredictable. An investor who concentrated his or her portfolio entirely in a domestic, large cap stock portfolio such as the S&P 500 Index might not have enough funds available if there was an unexpected need for cash. An investor in a more diversified approach has a higher probability of being able to fund an emergency with short notice because of the lower volatility of their portfolio while not giving up any performance in the long run.
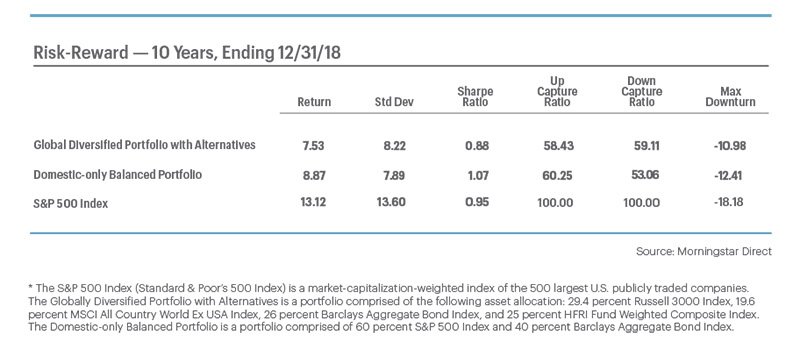
From 2009 until 2018, the most recent ten-year period being studied, large capitalization domestic stocks have had an extended period of outperformance. As one might expect, for the past ten years a DOBP approach would have outperformed a GDPA approach by 1.34 percent, and an investment in the S&P 500 would have dramatically outperformed both more diversified strategies. However, this performance came with significantly more risk.
So, on December 31, 2018 the prior 20 years began with a ten-year period where global diversification added value, followed by a 10-year period when a domestic only portfolio provided superior returns. So which investment strategy is most appropriate for long term investors? If an investor had invested $10,000 in each strategy on December 31, 1998, the results 20 years later wouldn’t be very different.
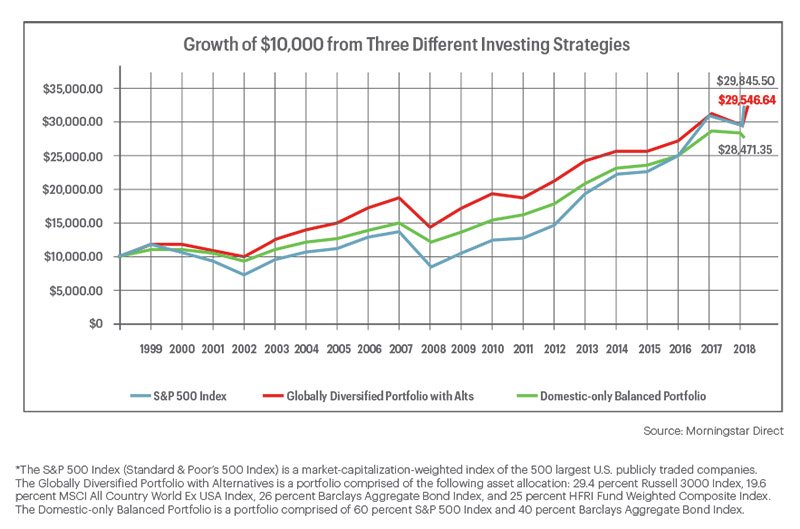
The all S&P 500 Index portfolio would have resulted in the highest ending amount, but only about $300 more than the GDPA approach, and with a lot more volatility. The DOBP portfolio would have resulted in the least amount, trailing the GDPA portfolio by a little more than $1,000. Since past performance is not a good predictor of future returns, basing a decision on historical returns is not enough. This analysis shows that any of the three strategies are likely to be effective over a long-term time period. However, both more diversified strategies provided very similar returns with a lot less volatility, so for most investors it is not prudent to be invested in a portfolio so highly concentrated in only one asset class.
When choosing between the global portfolio (GDPA) and a purely domestic portfolio (DOBP), the performance differential is small for the entire 20-year period. However, each strategy has experienced periods of dramatic relative outperformance. This cycle can be seen more clearly in the following chart.
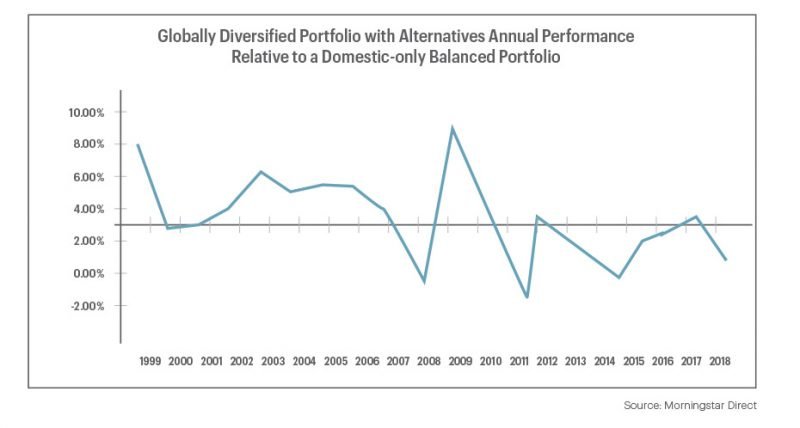
When the blue line is above zero, a GDPA portfolio outperformed the DOBP portfolio for that year. When the line is below 0.00 percent, a DOBP portfolio outperformed the GDPA portfolio for that year. There appears to be a clear differentiation between the first ten years, when the GDPA portfolio mostly outperformed a DOBP, and the most recent 10 years, when DOBP mostly outperformed GDPA. After nearly ten years of a domestic-only portfolio out-performance, what is the likelihood that trend continues?
Of course, we do not believe in attempting to time exit and entry from the markets. Investment trends are extremely difficult to predict with any regularity and even more difficult to trade. We help our clients prepare for difficult market environments by managing the portfolio risk of each of our clients in order to help them develop a prudent, globally diversified asset allocation designed for the long term.
However, with economic growth in many foreign countries expected to outpace U.S. growth and valuations that are much cheaper in many other countries, it is reasonable to believe that we are closer to the end of the current cycle of domestic stock leadership, not the beginning. Going forward, we believe that a globally diversified portfolio that utilizes alternatives provides for the highest probability of success in meeting our clients’ investment goals.
It is also important to note that this study only focused on static portfolios throughout the entire time period and does not represent any actual portfolio or historical performance. It did not take into consideration all the ways HBKS Wealth Management adds additional value through a disciplined process of managing client portfolios. This process includes making small tactical asset allocation shifts in order to take advantage of pricing anomalies between asset classes. It includes rebalancing our clients’ portfolios back to the targeted allocation for each asset class, which instills the discipline of selling those investment which have risen the most in price and reinvesting in those assets which are relatively inexpensive. We also work to minimize the gains that are a necessary part of portfolio management in order to increase our clients’ after-tax returns.
IMPORTANT DISCLOSURES
The information included in this document is for general, educational, and informational purposes only. It does not contain any investment advice, does not address any individual facts and circumstances, and cannot be relied on as providing any investment advice. If you would like investment advice regarding your facts and circumstances, please contact a qualified financial advisor.
The analysis is based on hypothetical allocations and a back tested analysis conducted using Morningstar tools and data from indices. It does not represent actual portfolios or actual performance over the time period discussed. It is not HBKS® Wealth Advisors (“HBKS”) policy to publish, market or advertise any back-tested, composite, performance, or model performance figures for actual portfolios. The analysis is designed to help explain generally how the described allocations might have performed over the time period discussed. The back-testing in this paper involves comparing the different asset mixes in each allocation by representing the asset classes with a market index. The actual returns from this index are then used to construct a composite return for the hypothetical allocations. The returns have not been adjusted for inflation and taxes. The performance data are shown both on an annual basis and compounded over time.
Actual portfolios may not perform the same as the allocations discussed herein due to various factors not considered in this analysis. The allocations presented are not the only allocations that can be used for this type of analysis and other allocations could have meaningfully different results, including results much lower than those calculated for the Globally Diversified Portfolio presented here. The time period covered by this analysis was chosen as a round number to represent a large enough period to include multiple market cycles, but does not represent a unique or required time frame. If a different time period were chosen the results of this analysis could be materially different.
Historical performance results for investment indices, investment categories, and/or hypothetical allocations have been provided for general comparison purposes only. Past performance of any indices may not be indicative of future results, and comparative indices may be more or less volatile than indicated here, may react differently to varying economic and market conditions, and may be affected by other factors which impact how the indices compare to the allocation discussed. The indices, categories and/ or hypothetical allocations generally reflect the reinvestment of dividends, but do not reflect the deduction of transaction and/or custodial charges, the deduction of an investment management fee, the impact of taxes, and/or the timing of fee deductions, the incurrence of which would have the effect of decreasing historical performance results. Although your account(s) invest in securities that may be generally similar in type to the related indices, categories and/or hypothetical allocations, the particular issuers, industry segments, geographic regions, and weighting of investments in your account do not necessarily track the index.
Back tested performance differs from actual performance because the allocations are designed with the benefit of hindsight, which can impact how they are designed. Back tested performance results have inherent limitations since they do not include how the adviser’s decision-making process is impacted by material economic and market factors during the time period which can materially affect performance results. Factors which could affect decisions adjustments to your allocation and the timing of those adjustments include, but are not limited to: changing market conditions; individual client liquidity inflows and outflows; changing cash needs by the client; the cost impact of transactions; the tax impact of transactions; tax-management strategies; estate planning needs; frequency and precisions of rebalancing based on target allocations; and changes in client investment objectives. These adjustments could materially affect the performance of an actual portfolio leading to significantly different results.
It should not be assumed that your account holdings correspond directly to any comparative indices, categories and/or hypothetical allocations, and those presented are not a required method for managing or allocating an account. There may be material limitations with respect to this analysis, including, but not limited to: (1) there could have been material differences between the performance in the analysis and how your account would have performed during the corresponding time period had you been a HBKS client during such time period; and, (2) there may be other similarly situated HBKS client accounts that performed better or worse than the analysis during the corresponding time period for various reasons, including the date on which HBKS was engaged, variations in portfolio holdings, fee differentials, and any client-imposed restrictions.
This analysis is not a promise or guarantee as to how your portfolio will perform. Any investment involves some degree of risk, and different types of investments involve varying degrees of risk, including loss of principal. It should not be assumed that future performance of any specific investment, strategy or allocation (including those recommended by HBKS) will be profitable or equal the corresponding indicated or intended results or performance level(s).
The historical and current information contained in this document was obtained from or prepared by other sources, including Morningstar. It was not independently verified but was obtained from sources believed to be reliable. HBKS does not guarantee its accuracy and does not assume liability for any errors in information obtained from or prepared by these other sources.
HBKS® Wealth Advisors is not a legal or accounting firm, and does not render legal, accounting or tax advice. Contact an attorney or CPA if you wish to receive legal, accounting or tax advice. Investment advisory services are offered through HBK Sorce Advisory LLC, doing business as HBKS® Wealth Advisors. NOT FDIC INSURED – NOT BANK GUARANTEED – MAY LOSE VALUE, INCLUDING LOSS OF PRINCIPAL – NOT INSURED BY ANY STATE OR FEDERAL AGENCY
INDEX DEFINITIONS
Barclays Aggregate Bond Index – The Barclays Capital Aggregate Bond Index is composed of the Barclays Capital Government/Corporate Index, the Barclays Capital Mortgage-Backed Securities Index, and the Barclays Capital Asset-Backed Securities (ABS) Index. The Barclays Capital Aggregate Bond Index includes fixed rate debt issues rated investment grade or higher by Moody’s Investor’s Service, Standard & Poor’s Corporation, or Fitch Investor’s Service, in that order. It also includes Commercial Mortgage Backed Securities. Bonds or securities included must be fixed rate, although they can carry a coupon that steps up or changes according to a predetermined schedule; must be dollar- denominated and nonconvertible; and must be publicly issued. All returns are market value weighted inclusive of accrued interest.
MSCI All-Country World Index (ACWI) ex USA – The MSCI ACWI ex USA Index is a free float-adjusted market capitalization index designed to measure equity market performance in global developed and emerging markets, excluding the United States. The MSCI ACWI ex USA Index captures large and mid cap representation across 22 of 23 Developed Markets (DM) countries (excluding the US) and 26 Emerging Markets countries. With 2,206 constituents, the index covers approximately 85% of the global equity opportunity set outside the United States.
Russell 3000 Index – The Russell 3000 Index is a market-capitalization-weighted equity index maintained by the FTSE Russell that provides exposure to the entire U.S. stock market. The index tracks the performance of the 3,000 largest U.S.-traded stocks which represent about 98% of all U.S incorporated equity securities.
Standard & Poor’s 500 Index (S&P 500) – The 500 stocks in the S&P 500 Index are selected by a Standard & Poor’s selection committee and are based on industry representation, liquidity and company stability. The index is a measure of large cap U.S. stocks. However, the stocks in the S&P 500 are not the 500 largest companies in the United States; instead, the S&P 500 is designed to capture the returns of large cap stocks in many different sectors of the U.S. economy. The Index is market capitalization weighted.
The HFRI Fund Weighted Composite Index – is a global, equal-weighted index of over 1,400 single-manager hedge funds that report to HFR Database. Constituent funds report monthly net of all fees performance in US Dollar and have a minimum of $50 Million under management or a twelve (12) month track record of active performance. The HFRI Fund Weighted Composite Index does not include Funds of Hedge Funds.